In our previous article, we explored how the Model Context Protocol (MCP) is acting as a "universal translator" for AI, allowing LLMs to access and understand data from your software stack. But text-based insights were just the beginning.
Our goal at Chift has always been to ensure fast retrieval of financial data to integrate it into any financial software. We now want to go a step further and allow business owners and accountants to unlock their data in a new way. Our first hint was to give them access to this data through the lens of an AI, the reason why we developed our first MCP Server. Quickly, we realized there were more possibilities to unlock the full potential of AI.
Today, we want to talk about a piece of the puzzle that makes this vision possible: the new External Apps specification for the MCP standard.
The missing piece: visualizing the context
Until now, the conversation around MCP has focused largely on servers (data sources like the Chift API) sending raw data to clients (AI interfaces like ChatGPT or Claude) for it to interpret and present the results back to you. But for complex sectors like fintech, text-based answers often aren't enough. You don't just want to "talk" to your data, you want to be able to see it.
The new standard for applications acts as a bridge for this exact scenario. It outlines how to embed applications directly into your chat interface through the MCP protocol.
Think of it as the difference between asking "What is my revenue trend?" and getting a text summary, versus asking the same question and having a live, interactive chart instantly pop up in your interface.
Seeing it in action: a financial "Test Run"
We recently put this to the test to see how it handles real-world financial questions. The results were not just accurate but also provided easy access and useful insights for users . It proved that any business owner could prompt questions they face daily to get powerful insights.
In our test, we walked through a scenario that many financial teams face daily: managing supplier debts. Instead of navigating through multiple dashboard menus, we simply asked the AI: "What are the supplier invoices left to pay?"
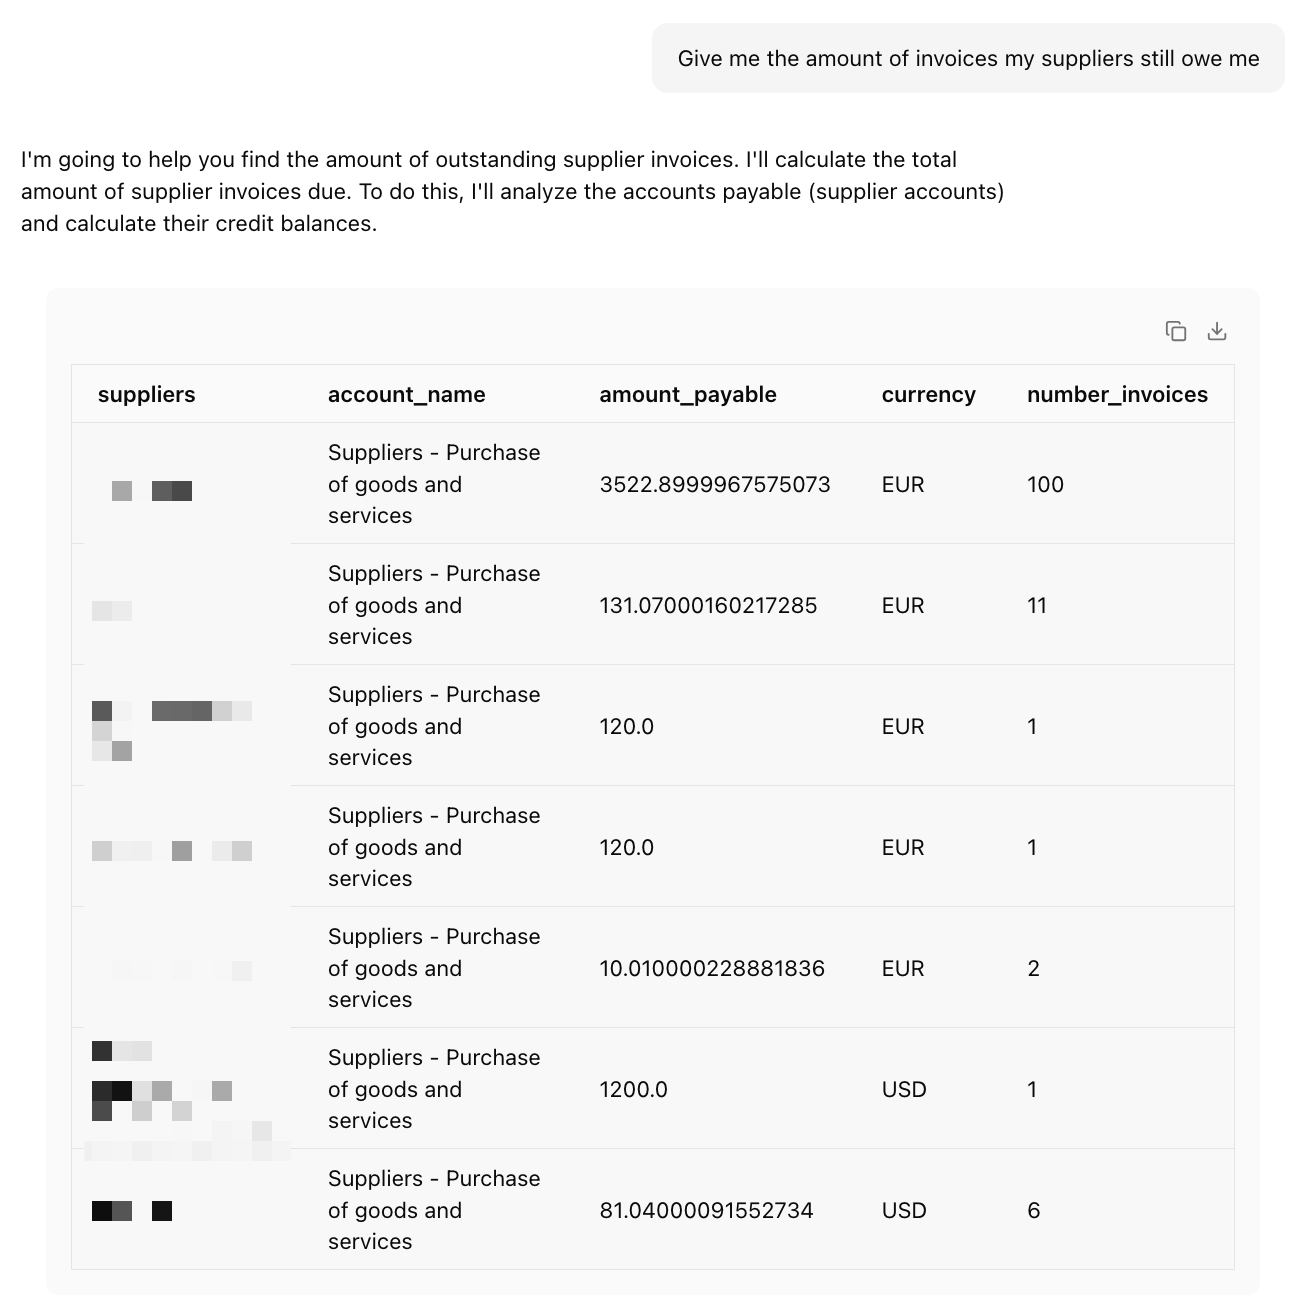
Instead of returning a long, hard-to-read list of transactions, the MCP workflow triggered a sequence of smart actions:
- Data Extraction: The agent utilized Chift's API to fetch the relevant accounting entries.
- Aggregation: It understood the need for a summary, grouping the data by supplier.
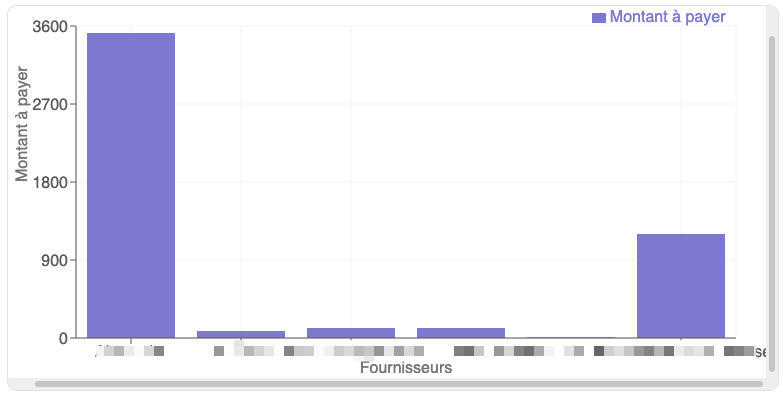
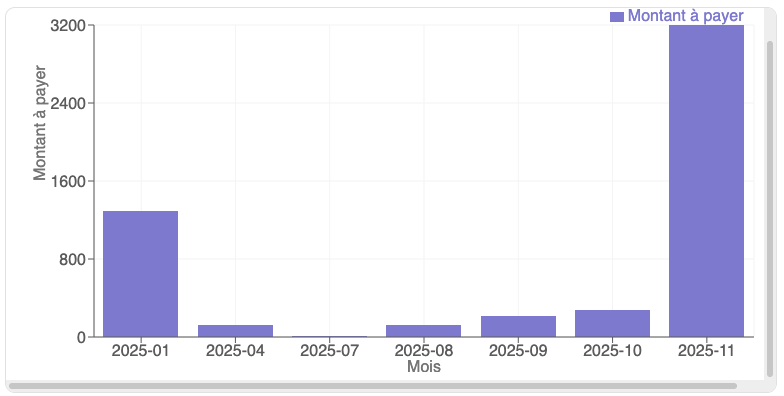
- Visual Rendering: It instantly generated a bar chart, allowing us to visually compare outstanding debts per supplier at a glance.
But the real power lies in the follow-up.
We then asked to see these invoices by "creation month" to identify which debts were most urgent. The system immediately pivoted, re-aggregated the data by date, and presented a new visualization alongside a detailed "aging balance"
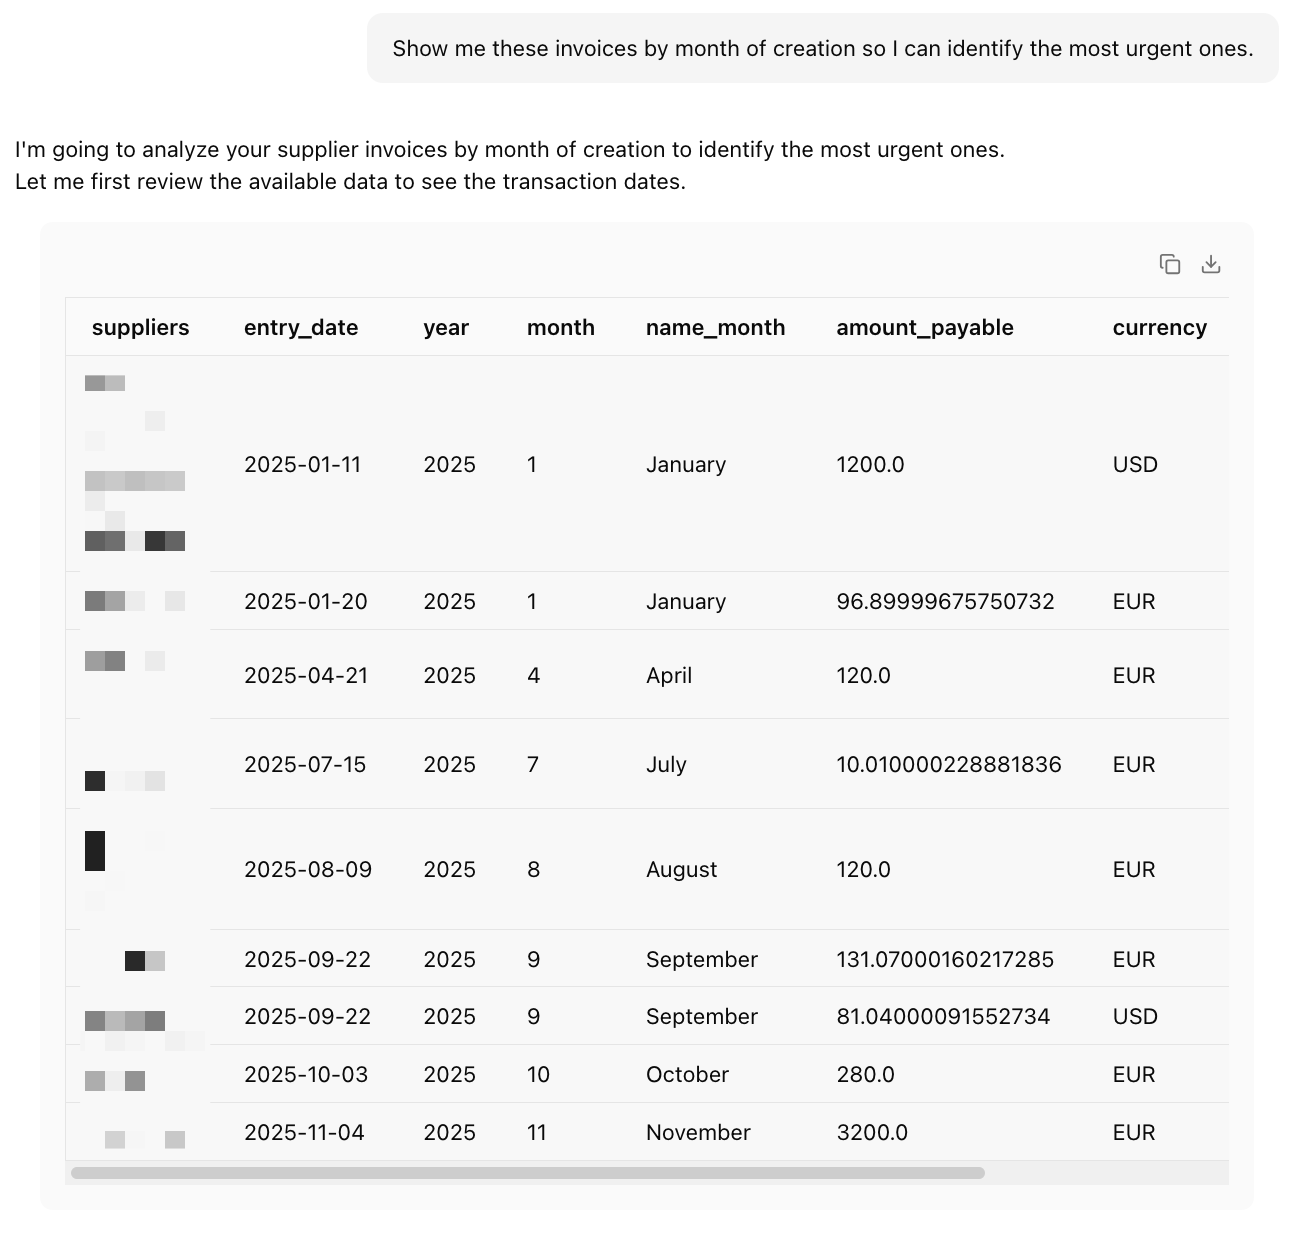
This capability fundamentally changes how users interact with the financial data provided by Chift.
Extracting insights in an instant
Because Chift unifies data from accounting, POS, and eCommerce tools, this new standard allows users to extract data accessible from the Chift API and transform it into visual intelligence immediately.
- Fast retrieval: The Chift Unified API provides the relevant financial data points from the underlying software (like Quickbooks, Pennylane, or Shopify).
- Instant insight: The MCP application layer handles the logic.
- Interactive visualization: Instead of a static report, the MCP-compatible app renders the data as a dynamic visualization.
Imagine an AI agent that doesn't just tell you that your cash flow is down, but plots the exact dip on a graph alongside your outstanding invoices, allowing you to dive into your financial health.
A work in progress
This new specification is still evolving, but it paints a clear picture of the future. We are moving away from static dashboards towards dynamic interfaces where financial insights are generated on demand, tailored exactly to the user's current question.
By combining the structural power of the Chift API with the visual versatility of MCP's new standard, we are unlocking a new way to interact with financial data.
If you think that data visualization can improve your daily work, contact us to know more!
.jpg)

.webp)
.webp)
.webp)


.webp)


.avif)


